What Is a Phishing Simulation Heatmap and How to Read It?
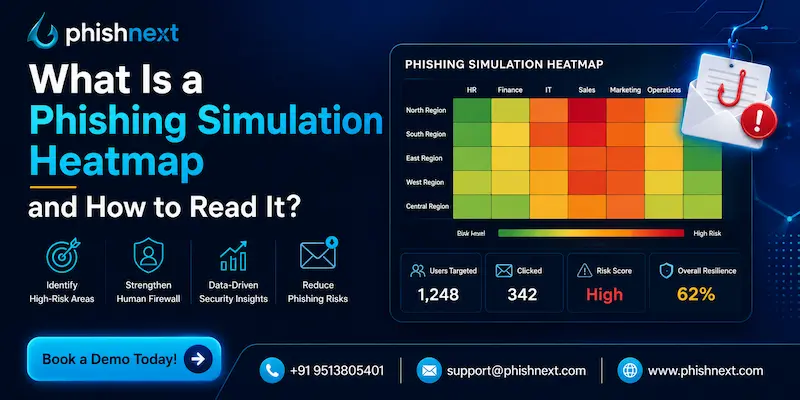
Do you know how a Phishing Simulation Heatmap can help users and organizations to protect themselves from future phishing attempts? If not, then you are at the right place. Here, we will talk about the Phishing Simulation Heatmap and related benefits in detail.
Moreover, we will introduce you to a reliable phishing simulation service offered by a reputable VAPT service provider. What are we waiting for? Let’s get started!
What Is a Phishing Simulation Heatmap?
A phishing simulation heatmap is a visual analytics resource that employs color-coded matrices to monitor vulnerability to social engineering across various organizational departments, locations, or roles.
It instantly reveals high-risk zones and weaknesses in security awareness by mapping metrics such as click rates, report rates, and frequencies of credential submissions. With this visualization based on data, security teams can pinpoint the locations where targeted, enhanced security training is most urgently required.
Let’s take a look at what a Phishing Simulation Heatmap is and how it can help businesses to improve their security posture!
Why Phishing Simulation Heatmaps Matter for Cybersecurity Training?
|
S.No. |
Factors |
Why? |
|
1. |
Pinpoints Specific Vulnerability Pockets |
It shows immediately which particular departments or job positions are the most vulnerable to clicking on harmful links. |
|
2. |
Enables Highly Targeted Training |
Enables security teams to target high-risk groups with tailored micro-learning campaigns, avoiding the need to engage the entire company. |
|
3. |
Measures the "Active Defense" Ratio |
By contrasting click rates deemed dangerous with behaviors associated with proactive email reporting, one can assess the actual attentiveness of employees. |
|
4. |
Simplifies Boardroom and Executive Reporting |
Translates intricate data on security awareness into a straightforward, color-coded map that executives can quickly grasp. |
|
5. |
Tracks Training ROI and Behavioral Trends |
Emphasizes the reduction of risk over time and demonstrates the direct effect and worth of continuous investments in security awareness. |
How does a Phishing Simulation Heatmap work?
A phishing simulation heatmap works in the following ways:
1. Data Harvesting via Controlled Simulations: Distributes realistic phishing emails that are harmless to employees in order to test their security reflexes in a real-world scenario without danger.
2. Tracking Employee Responses: Automatically logs all actions performed, such as opening emails, clicking on harmful links, and reporting phishing attempts.
3. Segmenting Data by Organizational Attributes: Classifies the outcomes of the simulation according to specific company divisions, geographic areas, job functions, and levels of seniority.
4. Applying the Color-Coded Risk Matrix: Transforms the aggregated metrics into a visual grid, using red to indicate high risk and green for strong vigilance.
5. Generating Actionable Security Intelligence: Indicates precisely where to implement customized training, modify email filtering rules, or strengthen technical controls.
Key Metrics Displayed in a Phishing Simulation Heatmap
The following are the key metrics displayed in a phishing simulation heatmap:
● Click-Through Rate (CTR): The proportion of employees who were taken in by the lure and selected the imitation harmful link.
● Reporting Rate: The proportion of users who took action to flag and report the suspicious email to the security team.
● Credential Submission Rate: The proportion of users who clicked and proceeded to the risky last step of providing sensitive login information.
● Resilience Ratio: A mathematical comparison of report rates with click rates, which reflects the overall condition of your human firewall.
● Repeat Offender Rate: The proportion of staff members who fail several simulation tests multiple times within a designated period.
● Open Rate: The proportion of recipients who opened the email, suggesting initial interest or vulnerability to the subject line.
How to Read a Phishing Simulation Heatmap Step by Step?
|
S.No. |
Factors |
How? |
|
1. |
Identify the Axes and Structure |
Identify the departments or roles that are listed on one axis, and the specific phishing techniques or dates that are listed on the other. |
|
2. |
Decode the Color-Coded Risk Legend |
Consult the color scale: bright red indicates high failure rates, while dark green denotes strong security awareness. |
|
3. |
Spot the "Hotspots" (Critical Vulnerabilities) |
Look for dense clusters of red or orange on the grid to quickly identify the departments that are most susceptible to attacks. |
|
4. |
Analyze the Silence vs. Active Defense |
Identify regions where the click rates are elevated yet there are no user reports, indicating teams that overlook threats instead of reporting them. |
|
5. |
Track the Progress Trend Over Time |
By comparing sequential heatmaps, you can determine whether critical red zones are transitioning to green, thus confirming the effectiveness of your training. |
Understanding Color Codes in a Phishing Heatmap
In a phishing heatmap, color codes utilize a traffic-light scale to immediately communicate the risk levels throughout the organization. Bright red and orange indicate critical vulnerabilities such as high click rates or credential submissions, whereas green zones represent resilient departments that successfully identify and report simulated threats.
Identifying High-Risk Users and Departments Using Heatmaps
You can identify high-risk users and departments using heatmaps in the following ways:
a) Isolate Aggregated "Red Zones": Quickly identify departments or user groups marked by dark red and orange risk blocks by scanning the grid.
b) Correlate Risk with Job Function: Determine segments that are at high risk by correlating elevated failure rates with certain positions, such as finance teams that are aimed at with invoice fraud.
c) Identify "Silent" Departments: Identify areas that exhibit high click rates alongside zero report rates, which suggests a total absence of awareness regarding security threats.
d) Cross-Reference Phishing Difficulty Levels: Assess which particular groups reliably do not succeed in even the easiest phishing simulation tests.
e) Track Temporal Discrepancies: Identify departments that experience a surge in risk during times of high stress, such as accounting teams that do not pass tests during the end-of-quarter rush.
Common Patterns and Trends Revealed by Phishing Heatmaps
|
S.No. |
Factors |
What? |
|
1. |
The "Busy Department" Vulnerability |
Teams with high transaction volumes (such as HR or Sales) demonstrate elevated failure rates as a result of handling large quantities of external emails. |
|
2. |
The "Authority Bias" Spike |
Emails that simulate impersonation of internal company executives or leadership result in enormous and instantaneous click-through rates across all departments. |
|
3. |
The "Security Silo" Paradox |
Basic, non-technical social engineering and HR tactics often succeed in highly technical departments (such as IT or Engineering), which may overlook them. |
|
4. |
Seasonal and Temporal Fatigue |
During times of heightened stress, like significant holidays, the yearly tax period, or the ends of financial quarters, risk levels increase significantly. |
|
5. |
The "Super-Clicker" Concentration |
It is often a small number of chronic repeat offenders who are solely accountable for a department’s low score. |
How to Use Heatmap Insights to Improve Security Awareness Training?
You can use heatmap insights to improve security awareness training in the following ways:
1. Deploy Contextual Micro-Learning: Provide brief, highly concentrated training modules that address the particular phishing lures a department has had difficulty with.
2. Adjust Simulation Difficulty by Department: To maintain a level of challenge in training, send basic tests to departments that are at high risk and advanced simulations to teams that are highly resilient.
3. Launch Targeted Coaching for Repeat Offenders: Deliver individualized coaching and remedial training directly to employees who repeatedly do not pass simulations.
4. Gamify Reporting and Drive Positive Competition: Utilize department scores to ignite a lighthearted rivalry, offering public rewards to the teams that achieve the highest report rates.
5. Optimize Technical Controls alongside Training: Enhance email filtering and limit access rights for departments identified as high-risk.
Best Practices for Analyzing Phishing Simulation Heatmaps
The following are the best practices for analyzing phishing simulation heatmaps:
● Normalize Data Against Department Size: Use percentages instead of raw click counts to assess risk, ensuring that smaller departments do not distort your data.
● Correlate Lure Templates with Department Roles: Examine the reactions of groups to particular types of bait to guarantee that the simulations correspond to their real-life job-related dangers.
● Focus on the Reporting-to-Click Ratio: Gauge active defense by monitoring whether employees are actively reporting threats, as opposed to merely avoiding clicks.
● Filter by Simulation Difficulty Levels: Measure genuine resilience by distinguishing between simple, evident phishing attempts and advanced, targeted spear-phishing situations.
● Establish a Rolling Historical Baseline: Examine current heatmap data in relation to your historical performance trends to pinpoint genuine behavioral enhancements over time.
Common Mistakes toAvoid When Interpreting Heatmaps
|
S.No. |
Mistakes |
What? |
|
1. |
Evaluating Raw Failures Instead of Percentages |
Causes larger departments to seem to be at greater risk than smaller teams, which are very susceptible. |
|
2. |
Treating Heatmaps as a Tool for Punishment |
Concentrates on naming and shaming employees who fail instead of recognizing systemic training deficiencies. |
|
3. |
Ignoring the Proactive Reporting Rate |
Concentrates exclusively on those who took the bait, ignoring positive threat-reporting behaviors entirely. |
|
4. |
Assuming "Green" Zones Equal Complete Safety |
Neglects the chance that a resilient department may have encountered a simulation that was either too easy or not pertinent. |
|
5. |
Disregarding Temporal and Seasonal Context |
Disregard outside factors such as tax season or quarter-end rushes that cause temporary increases in user failure rates. |
Conclusion: Turn Phishing Heatmap Insights into Stronger Cybersecurity Defense
Now that we have talked about what a Phishing Simulation Heatmap is, you might want to get a dedicated phishing simulation solution from a reliable source. For that, you can go for PhishNext, a dedicated phishing simulation platform offered by Craw Security.
PhishNext can help users to get introduced to various types of phishing attacks and the ways to evade such attacks with ease. Thus, they can feel at ease working in their work environment. What are you waiting for? Contact, Now!
Frequently Asked Questions
About Phishing Simulation Heatmap
1. What is a phishing simulation heatmap?
A phishing simulation heatmap serves as a visual analytics tool that employs a color-coded matrix to quickly monitor and showcase an organization's vulnerability to social engineering attacks, categorized by department, location, or role.
2. How does a phishing simulation heatmap work?
A phishing simulation heatmap works in the following ways:
a) Deploys Controlled Simulations,
b) Tracks Real-Time User Responses,
c) Segments Data by Organizational Attributes,
d) Applies a Color-Coded Risk Matrix, and
e) Generates Actionable Security Intelligence.
3. What metrics are shown in a phishing simulation heatmap?
The following metrics are shown in a phishing simulation heatmap:
a) Click-Through Rate (CTR),
b) Reporting Rate,
c) Credential Submission Rate,
d) Resilience Ratio,
e) Repeat Offender Rate, and
f) Open Rate.
4. How do you read a phishing simulation heatmap effectively?
To effectively interpret a phishing simulation heatmap, look for clusters of bright red or orange "hotspots" in the grid to quickly identify at-risk departments, and compare these failures to green zones to assess proactive threat-reporting trends throughout the organization.
5. What do the different colors in a phishing simulation heatmap represent?
In a phishing simulation heatmap, colors indicate different levels of organizational risk using a traffic-light scale: bright red and orange denote high-risk vulnerabilities such as elevated click or credential submission rates, while green represents robust resilience and proactive threat reporting.
6. How can a phishing simulation heatmap identify high-risk employees?
A phishing simulation heatmap identifies high-risk employees in the following ways:
a) Isolates the "Super-Clicker" Concentration,
b) Correlates Risk with Specific Job Functions,
c) Exposes the "Authority Bias" Vulnerability,
d) Identifies the "Silent" Responders, and
e) Tracks Performance Against Simulation Difficulty.
7. How often should organizations review phishing simulation heatmaps?
Organizations ought to examine heatmaps on a monthly basis (or following each simulation campaign) in order to tackle immediate vulnerabilities, and on a quarterly basis to assess long-term training trends.
8. What are the benefits of using phishing simulation heatmaps for security awareness training?
The following are the benefits of using phishing simulation heatmaps for security awareness training:
a) Instantly Visualizes Risk Profiles,
b) Enables Hyper-Targeted Training,
c) Measures Active Defense Culture,
d) Justifies ROI and Resource Allocation, and
e) Tracks Long-Term Behavioral Trends.
9. How can AI improve the accuracy of phishing simulation heatmap analysis?
AI can improve the accuracy of phishing simulation heatmap analysis in the following ways:
a) Filters Out Automated Sandbox Clicks,
b) Normalizes Metrics Based on Simulation Difficulty,
c) Predicts Future Vulnerability "Hotspots",
d) Consolidates Multi-Channel Risk Scores, and
e) Measures Time-to-Respond (TTR) Urgency.
10. Which phishing simulation platforms provide advanced heatmap reporting?
PhishNext, offered by Craw Security, is one of the amazing phishing simulation platforms provide advanced heatmap reporting.